CS639-Project
This project is maintained by xrylak
Traffic Livestream Analysis
Anders Carlsson (awcarlsson@wisc.edu), Fritz Ringler (fringler@wisc.edu), Casey Frank (csfrank3@wisc.edu)
Project Presentation Link
Problem
In terms of traffic, connectivity is costly. As cars overburden the streets of the US, our world becomes increasingly congested. Especially in larger cities, where around 90% of daily commuters use private vehicles, policymakers struggle to find tenable solutions (2). One commonly utilized option is physically expanding the capacity of roads, but urban planners are often hard-pressed in finding locations in which to allocate valuable resources into roads, but the construction required is often unrealistically costly in terms of both resources and money. Additionally, these massive roads would be grossly unnecessary during non-peak traffic hours, and once word got around that the road had expanded, people would flood in, and congestion would re-appear. This dilemma hints at the true problem, of which congestion is only a symptom. The true problem is the fact that the majority of people commute using specific roads at specific times of the day, colloquially known as “rush hours”.
Why It Needs to be Solved
There are multiple reasons why solving the problem of rush hours would help our society. One easily identifiable one is gas. For example, take New York, where during rush hour traffic, commutes are increased by an average of 27 minutes. Factor in the number of people commuting and average amount of fuel consumption per car, and you get about 12.5 billion dollars of wasted fuel every single day (1). Another reason is personal health. Recent studies have shown that during rush hours, the interiors of cars can become filled with dangerous levels of pollutants (3). Additional broad reasons include environmental impact and overall productivity. For all these reasons and more, it’s clear that striking a blow at the problem of rush hours would be greatly beneficial, both on a personal and societal level. Our project aims to provide a step in this direction.
Proposed Solution
Our proposed solution is an algorithm that, given the input of a live stream video of a stretch of road or intersection, records and displays important data relating to traffic flow. It first records and outputs the location/bounding boxes of vehicles on this road and their individual projected velocities. The velocities are measured in terms of pixels per second, and can be converted to real world measurements if scene geometry is known. The common direction of traffic flow, or the moving average of inidivual velocity vectors, is also displayed and recorded. Other data that we record and display is number of cars per time interval, a simple metric to guage traffic speed. All of these data points can be saved at certain time intervals and used for downstream traffic analysis tasks.
Method
For this project we used Python and openCV. Our method involves taking in a frame and processing it through a series of steps:
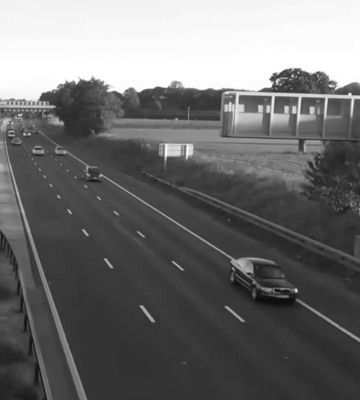
Step 1: Frame Differencing
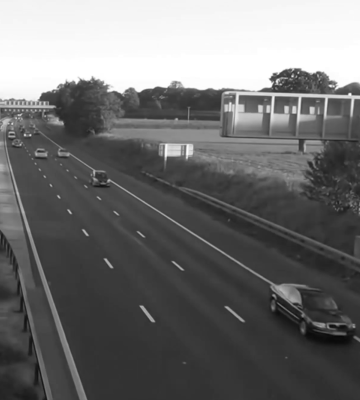
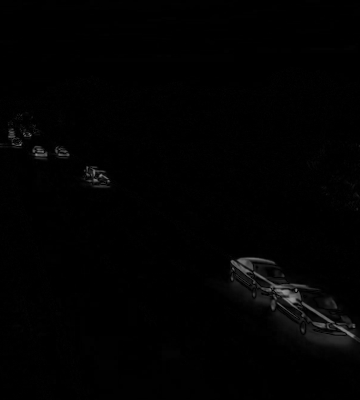
The first step is frame differencing. We find the difference in pixel values between two consecutive frames which correspond to a moving object.
 |
|---|
| frame1 |
 |
|---|
| frame2 |
 |
|---|
| abs(frame1-frame2) |
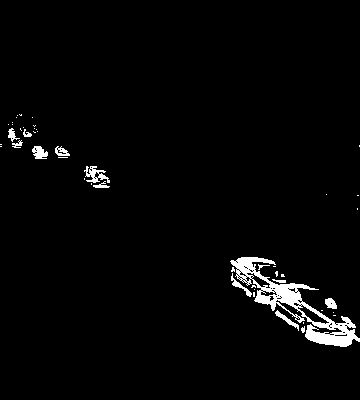
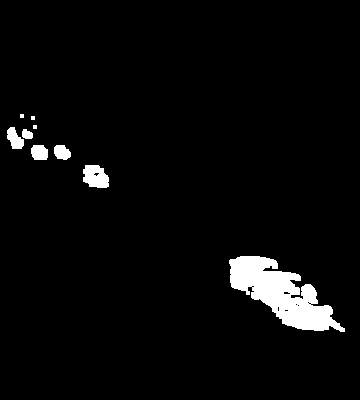
Step 2: Image Thresholding
The second step is thresholding, which involves assigning a 1 to values above the threshold in the frame differenced image, and 0 to values below the threshold. This helps to weed out some of the unwanted noise in the image.
 |
|---|
| After thresholding |
Step 3: Find Contours and Dilate
The third step is finding the contours and dilating them. Contours help identify regions in an image having the same intensity or color, while dilation, done via convolution with a kernel, helps connect any contours which are close enough to be considered a single one by expanding their area.
 |
|---|
| After dilation |
Step 4: Further Contour Cleaning
The fourth step involves more weeding out of unwanted contours. Contours which are too small compared to a threshold are removed. We also ignore contours outside of our area of interest: for example, we are only interested in contours in the area outlined by the red below.
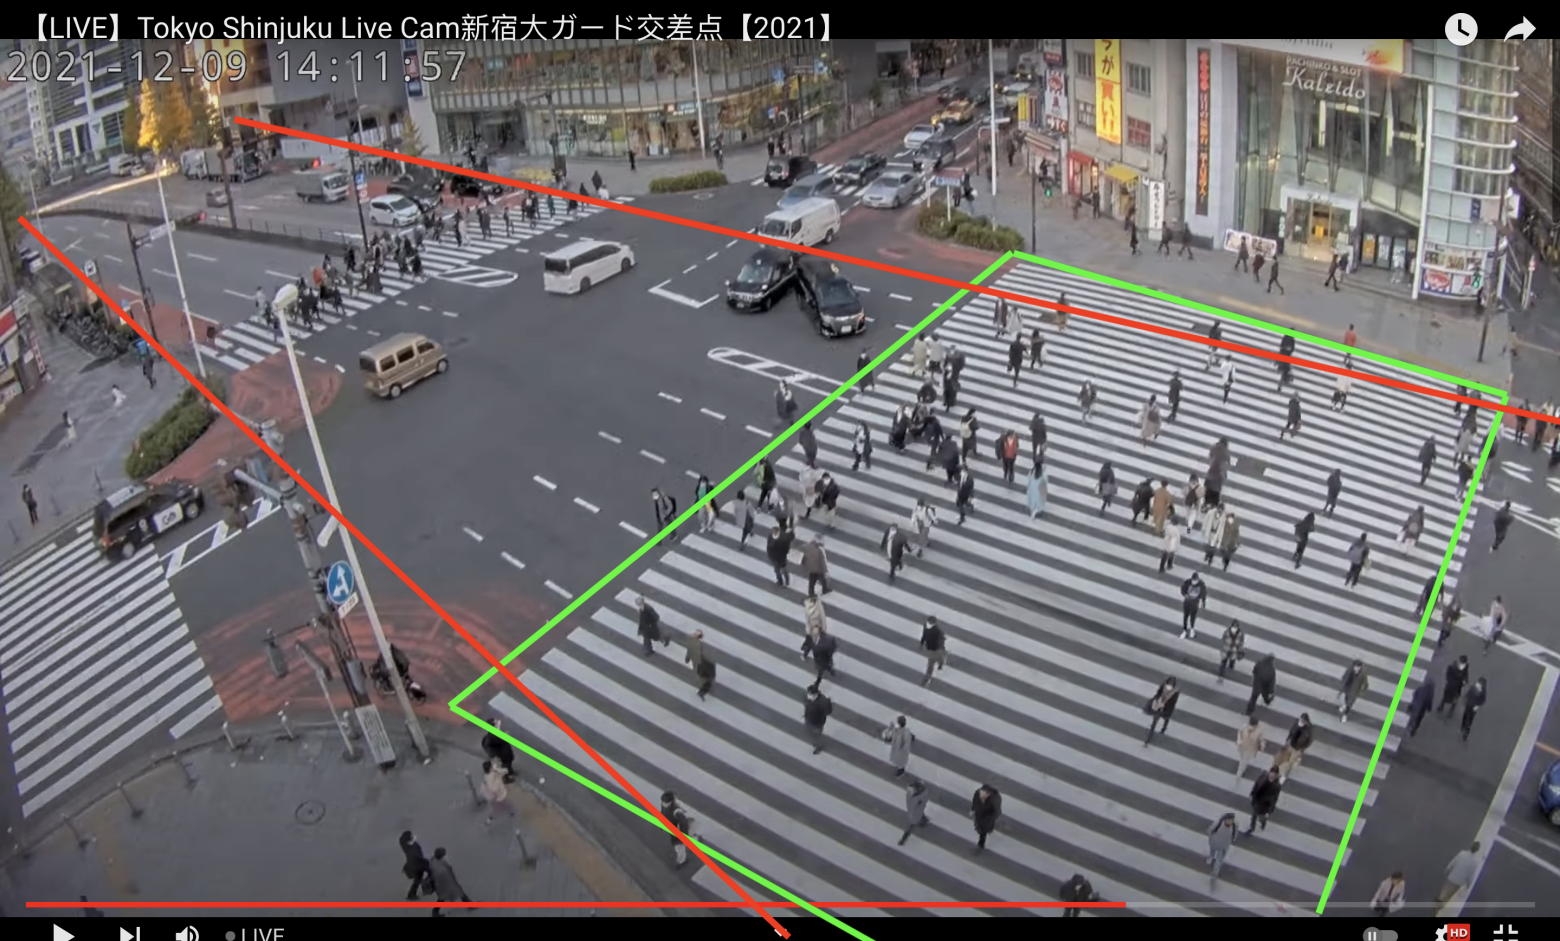 |
|---|
| Regions of interest |
Step 5: Record Data and Add to Processed Frame
Following this comes the data representation where velocities, direction, bounding boxes, and cars per duration of time is calculated, stored, and displayed on the processed frame. Finally, the frame is saved and this algorithm continues until each frame has been processed. The processed frames are then converted to a mp4 video and saved for viewing.
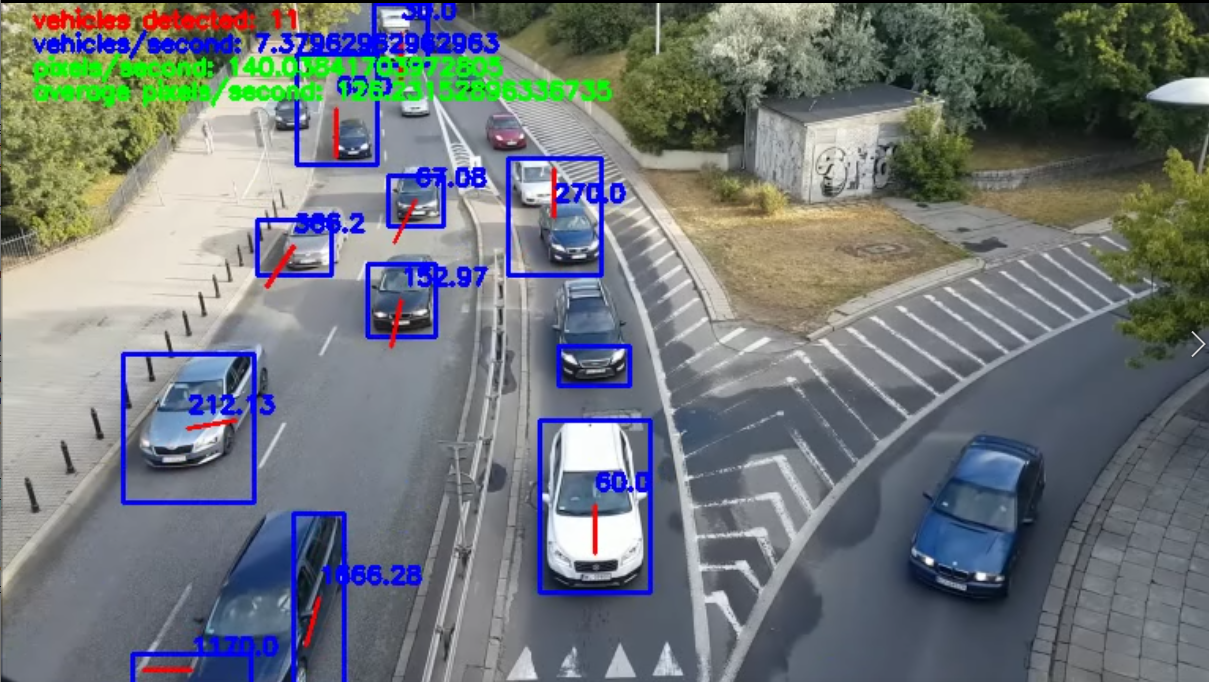 |
|---|
| After processing |
Results
The results of our algorithm were promising. The resulting video outputs were able to accurately estimate the average direction of traffic flow as well as traffic density. Vehicles were usually detected, and their individual directions and velocities were usually accurate as well. However, there is room for improvement. Since the video analysis takes place on a frame-by-frame basis, there are frames in which vehicles may not be detected, or their direction vector/speed is slightly innaccurate. Additionally, since we detect objects based solely on motion, cars can occasionally come close to one another, and be detected as one, rather than two, vehicles.
Video of Result
Revisions and Difficulties
Originally the project was going to deal with multiple live streams of traffic feed on a large scale but has been skimmed down to just working with individual videos/live streams with a focus on gathering information from individual traffic videos and displaying the information in an output video. One of the main challenges we faced was finding suitable livestreams for which to test on.
Future Directions
There are many different routes we could go down to expand on this project. The first direction to be pursued would need to be analysis of the geometry of a scene in relation to the cameras position. In doing so, the true velocity of cars could be estimated in a metric more useful than pixels/second. A more optimistic future expansion could be attaching this algorithm to multiple different cameras throughout a given city located at particularly busy intersections and stretches of road. The aggregated data from these live streams could be used to create live heat maps of traffic over time, and might help individuals identify better routes/times to use for commutes, as well as help urban planners identify choke points. We experimented with pedestrian flow analysis, where, similar to traffic flow, the aggregated movement data of pedestrians in big cities is collected, which could also be beneficial for city design and for crowd control purposes. This could also be applied to analyze line movement, such as predicting the wait time for a drive through restaurant or for a queue at an amusement park ride.
Sources
- https://www.theatlantic.com/sponsored/hitachi-building-tomorrow/global-rush-hour/237/
- https://www.brookings.edu/research/traffic-why-its-getting-worse-what-government-can-do/
- https://www.triplepundit.com/story/2017/health-impacts-rush-hour-pollution/16231
- https://www.technoarete.org/common_abstract/pdf/IJERCSE/v5/i3/Ext_57402.pdf
- https://www.analyticsvidhya.com/blog/2020/04/vehicle-detection-opencv-python/